Tallqvist, Torkel: Leadership in repetitively innovative mature companies
Publisher: Åbo Akademi University Press,
Biskopsgatan 13, Turku/Åbo, Finland.
Copyright © 2009 by Torkel Tallqvist.
Typography: Michael Diedrichs.
Printing house: Painosalama, Turku/Åbo.
Cover photograph: Rami Salle.
CIP Cataloguing in Publication: Tallqvist, Torkel,
Leadership in repetitively innovative mature companies /
Torkel Tallqvist. – Åbo:
Åbo Akademi University Press, 2009.
Diss.: Åbo Akademi University.
ISBN 978–951–765–463–0 and
ISBN 978–951–765–464–7
(digital)
LIST OF FIGURES
Figure 1. Managing Life Cycle of Ideas, p. 8
Figure 2. Innovation Process Scheme, p. 14
Figure 3. Flow of the Report, p. 17
Figure 4. Overlap of 'Management' and 'Leadership', p. 19
Figure 5. Frame of Theoretical References, p. 22
Figure 6. Lead Times from Invention to Sales Takeoff, p. 25
Figure 7. The Evolution of Market Structure For Product Innovations, p. 26
Figure 8. Years of Lead Times of 30 Major US Innovations During Past 150 Years, p. 27
Figure 9. Design Hierarchies and Dominant Design, p. 28
Figure 10. Number of Firms Participating in Six Industries in the USA 1874–1988, p. 29

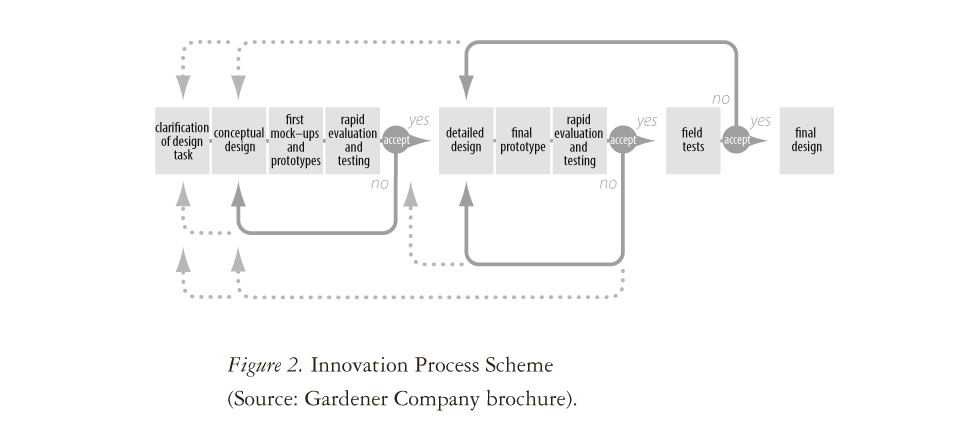
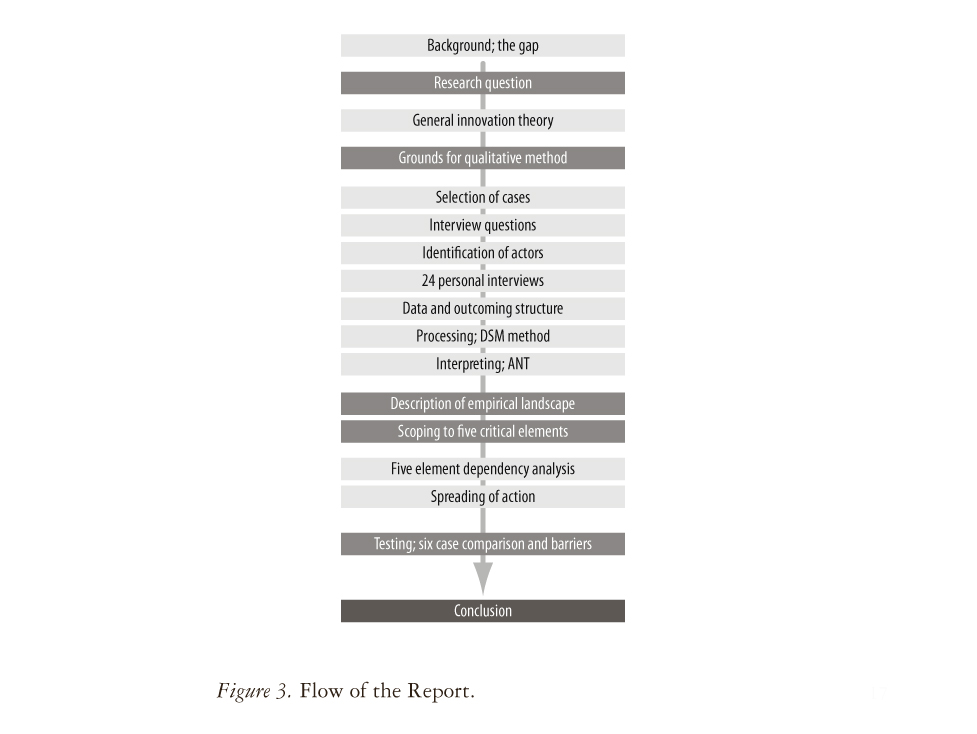
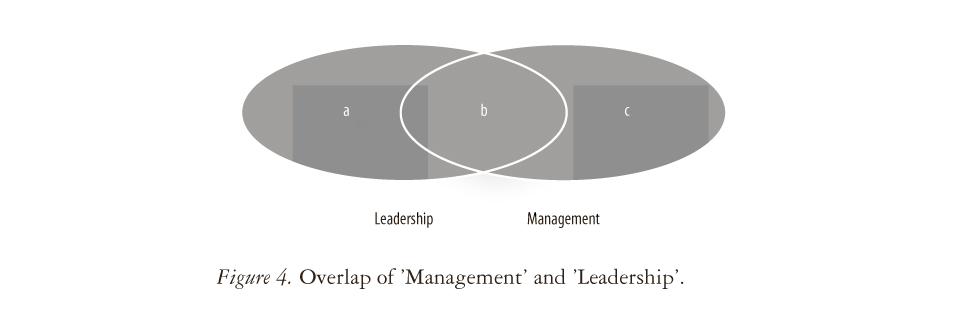
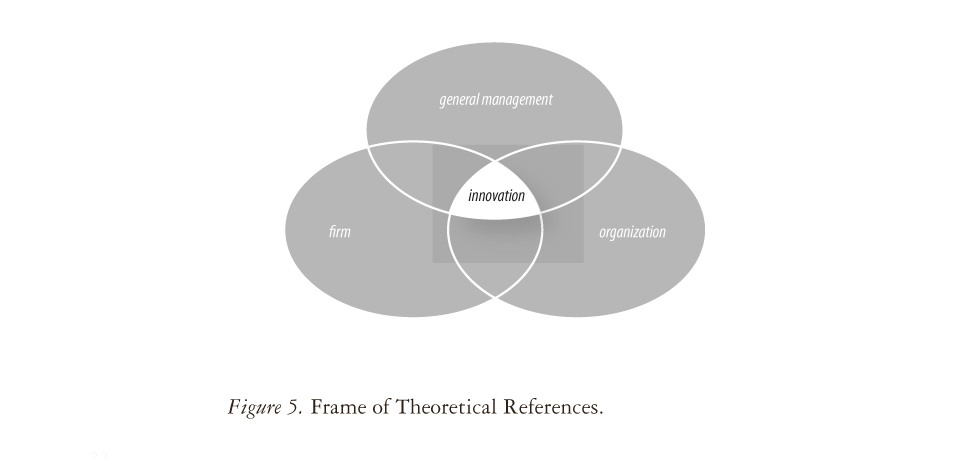
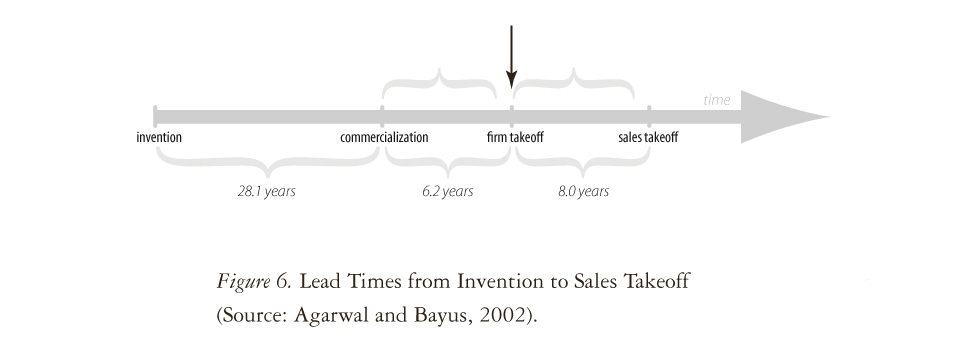
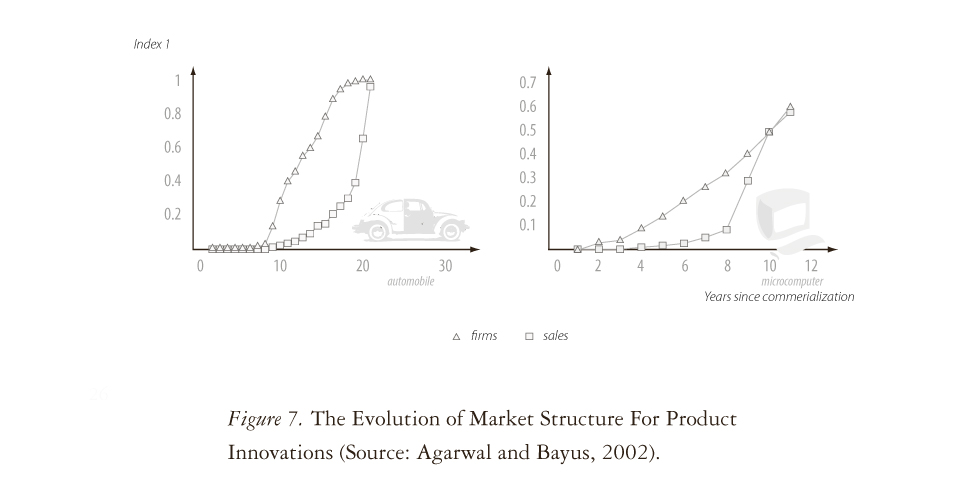
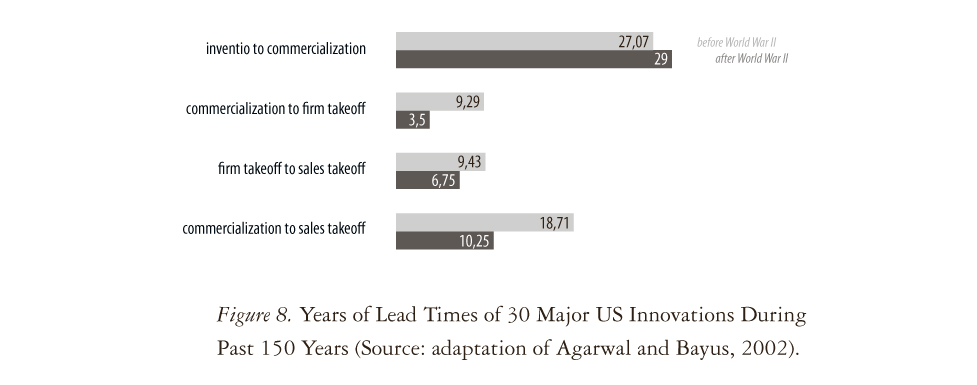
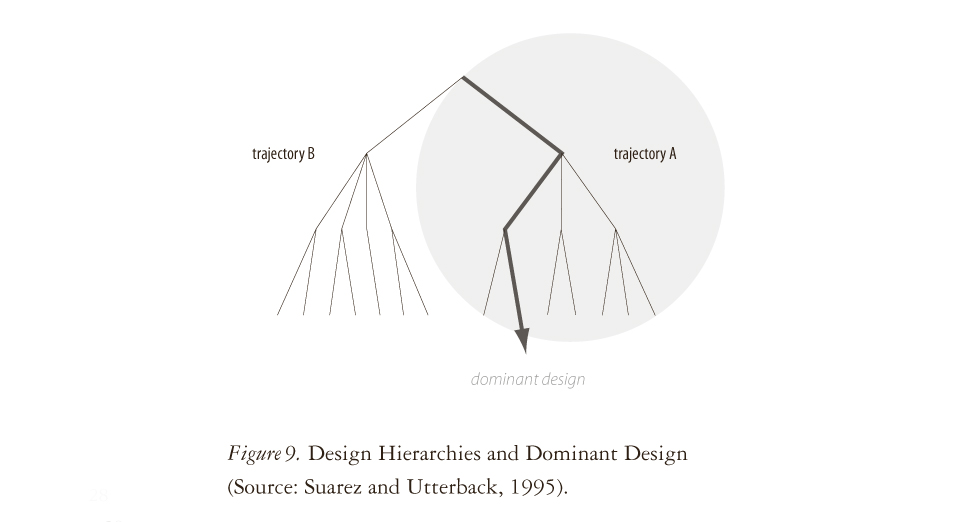
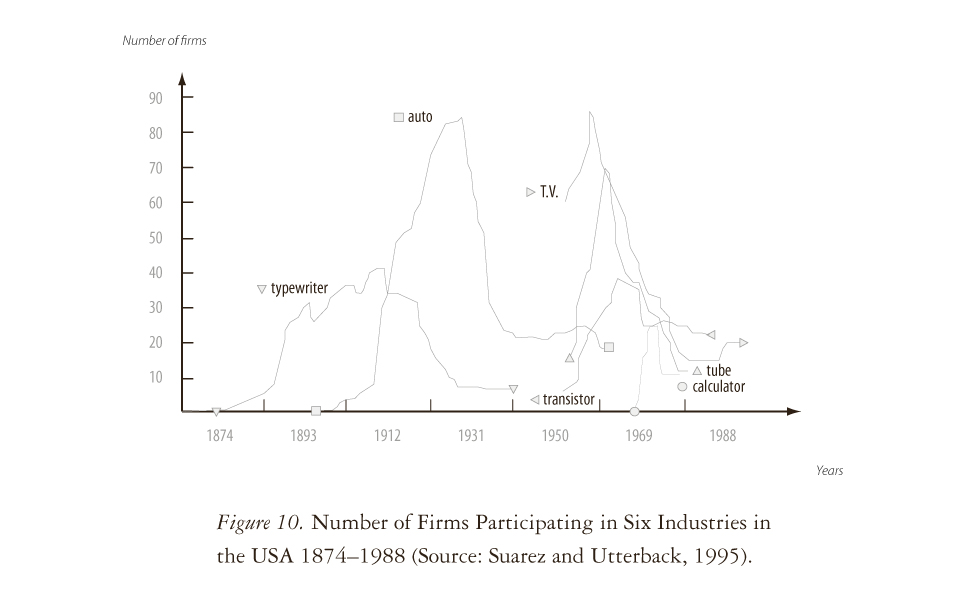
Figure 11. Dynamics and Waves of Innovation, p. 30
Figure 12. Kinds of Innovations, p. 31
Figure 13. Linear Sequential Coupling Compared With Simultaneous Coupling of Knowledge, p. 33
Figure 14. Factors Affecting the Success of Product-Development Projects, p. 36
Figure 15. Situational Variables, p. 39
Figure 16. Incidence of Business Model and Related Management Keywords 1975–2001, p. 43
Figure 17. An Adaptation of Porter's Generic Strategies, p. 48
Figure 18. Types of Strategies, p. 50
Figure 19. Knowledge Spiral and Knowledge Conversion, p. 64
Figure 20. Spiral Organizational Knowledge Creation, p. 66
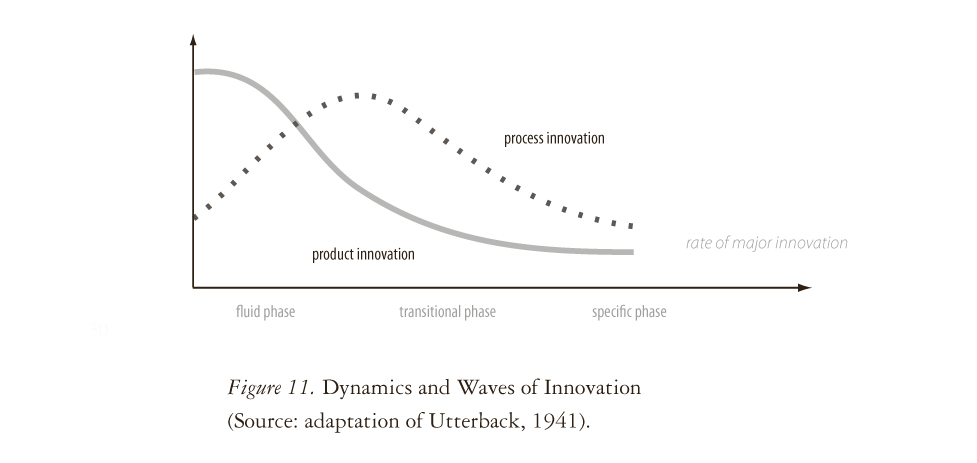
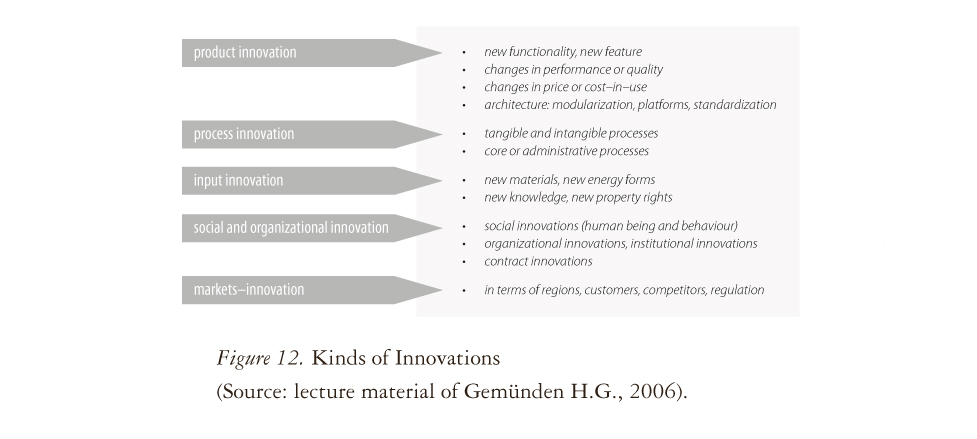
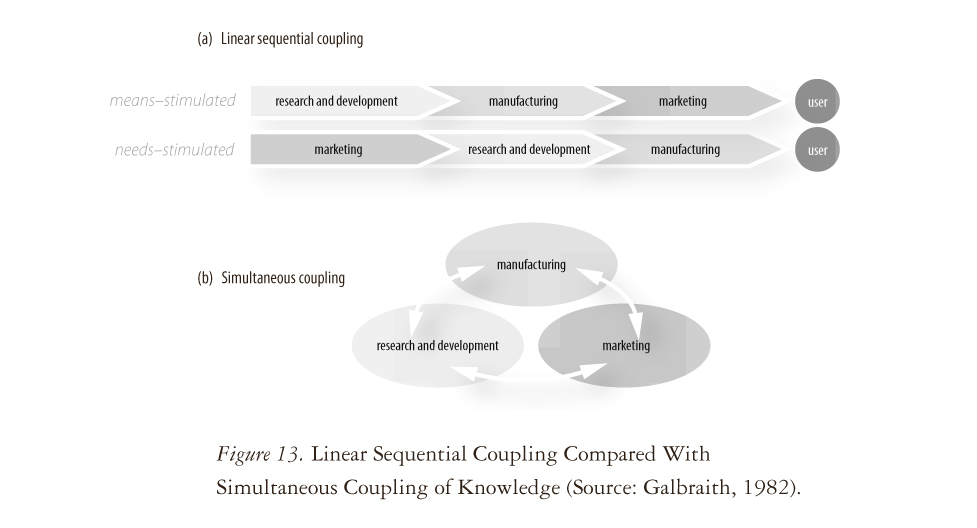
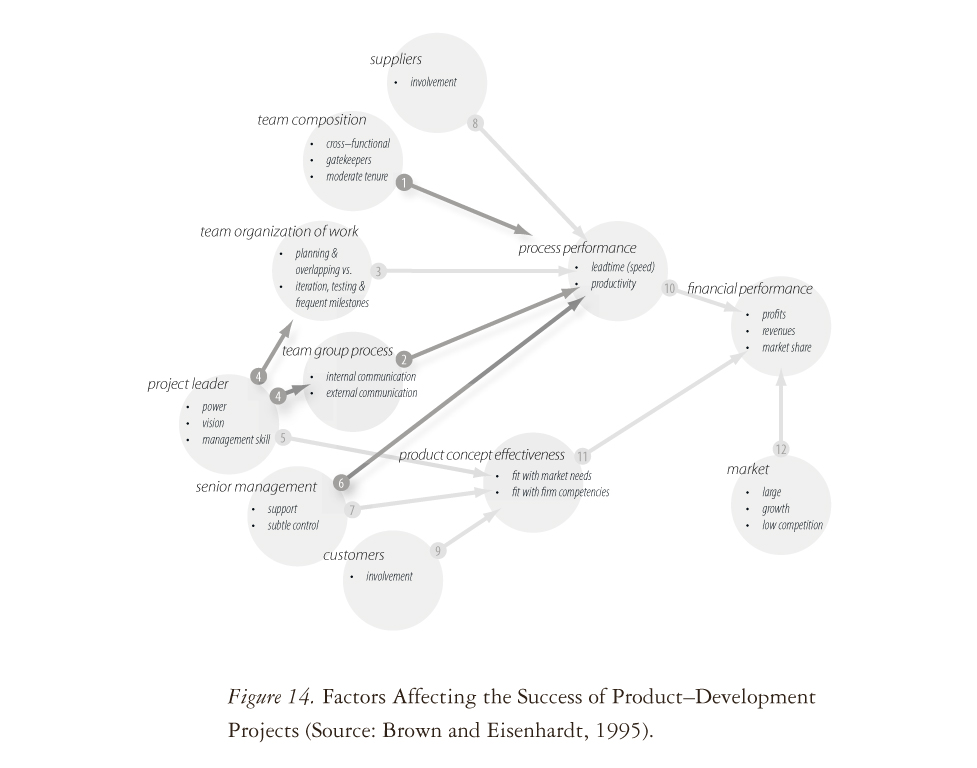
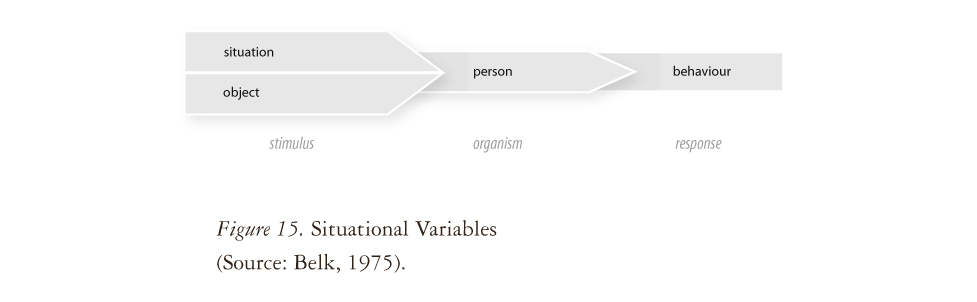

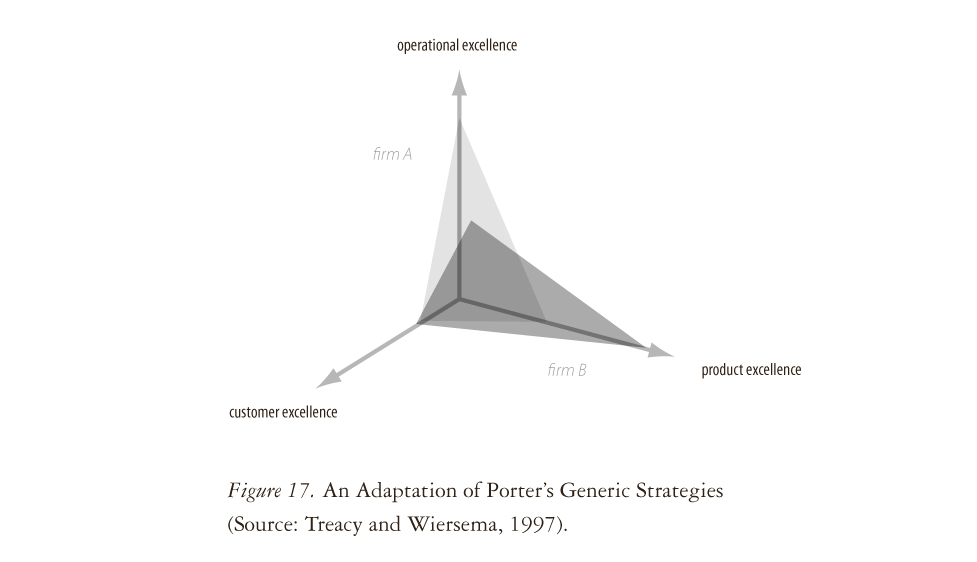
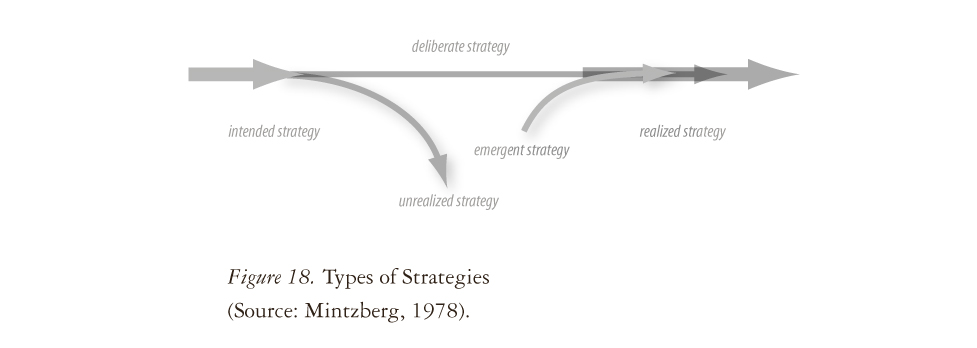
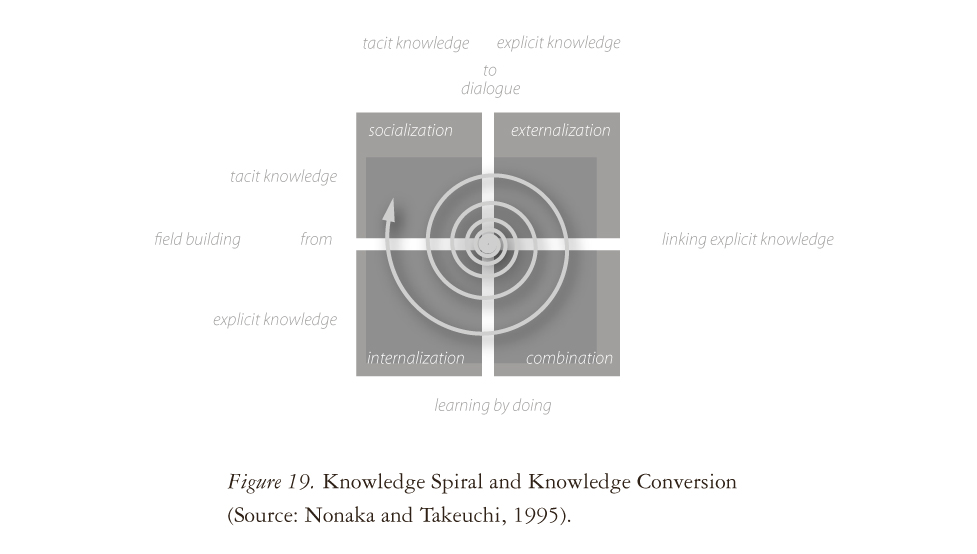
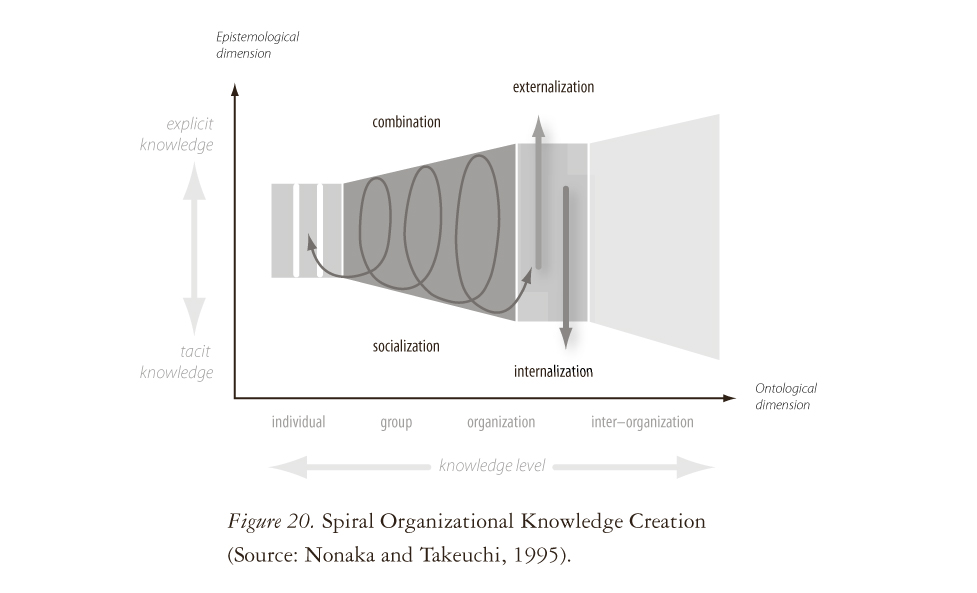
Figure 21. Values in Conflict, p. 74
Figure 22. Wind Shelter, p. 97
Figure 23. Prior Knowledge and Discovery of Entrepreneurial Opportunities, p. 100
Figure 24. Evolution of the Entrepreneurial Network, p. 103
Figure 25. Definition and Distribution of Promotor Structures, p. 106
Figure 26. Success of Innovation and Promotors, p. 108
Figure 27. Roles and Stages of Innovation, p. 110
Figure 28. Iterative Way to Work, p. 116
Figure 29. Sample of Coding, p. 126
Figure 30. Three Domains in the Thoughtworld of Leaders in Mature Innovative Firms, p. 134
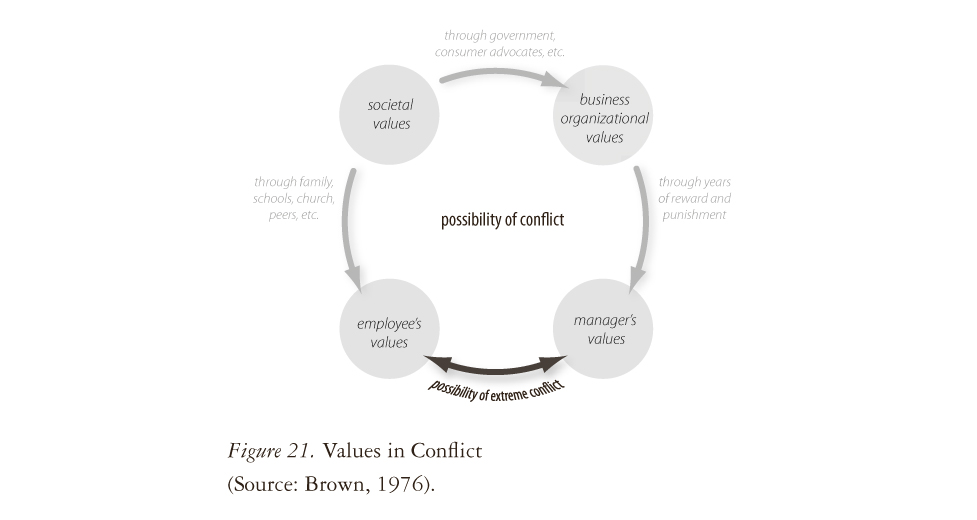
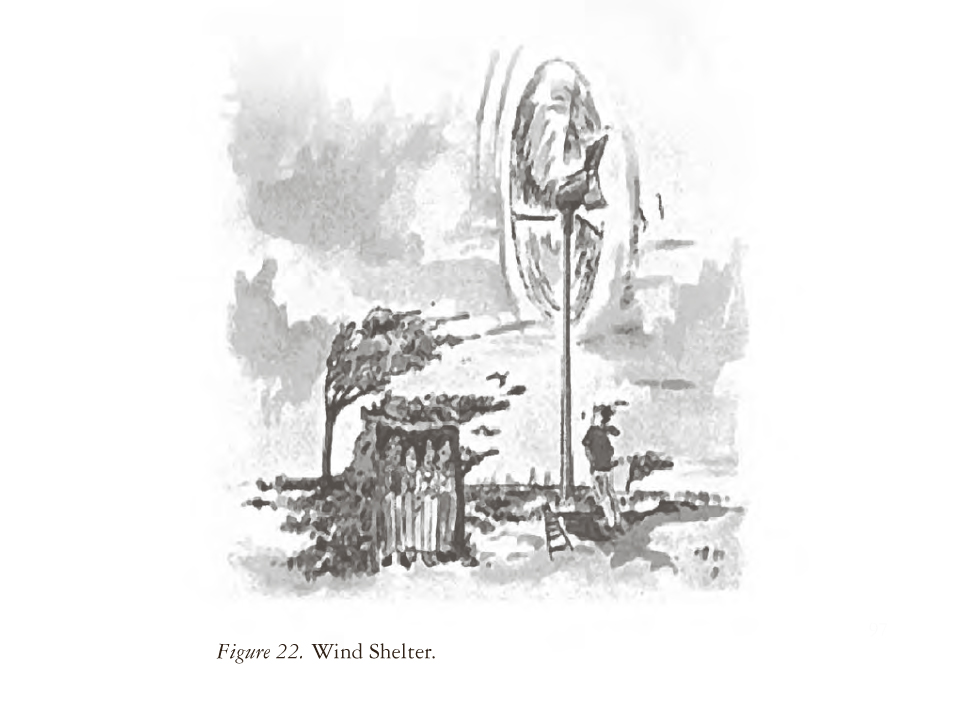
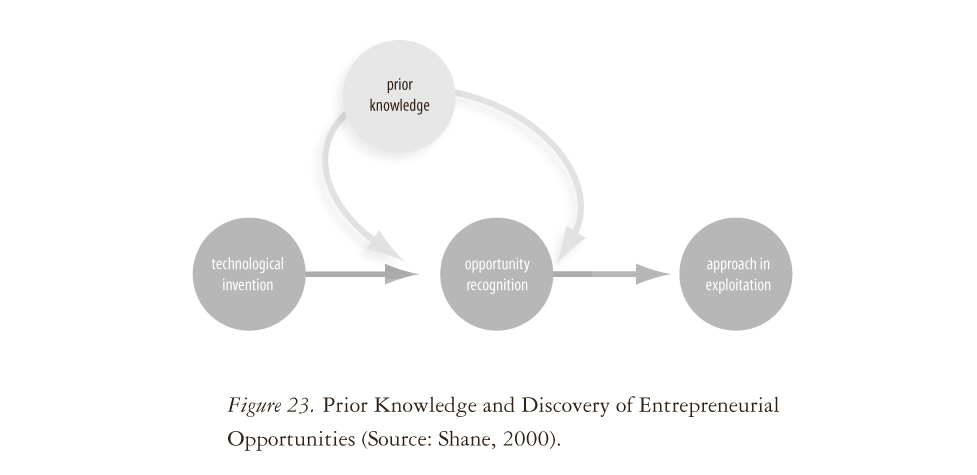
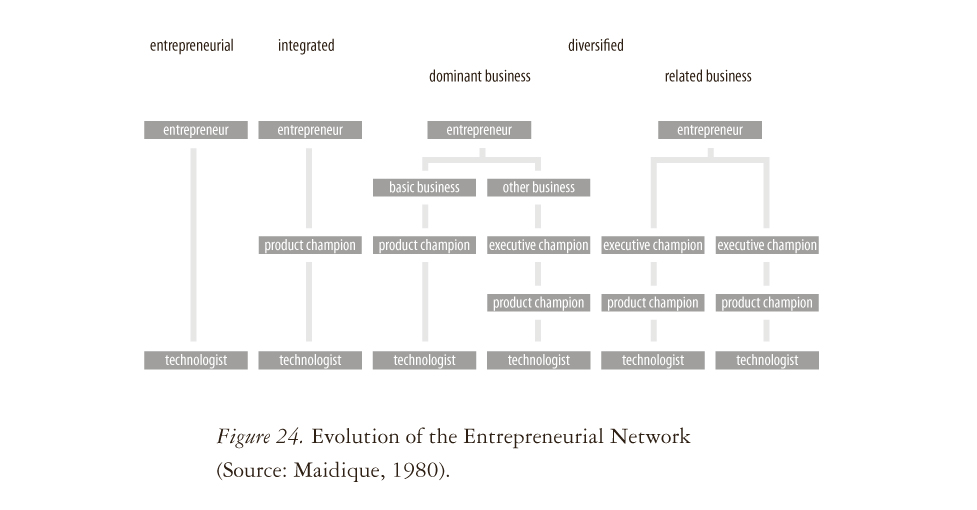


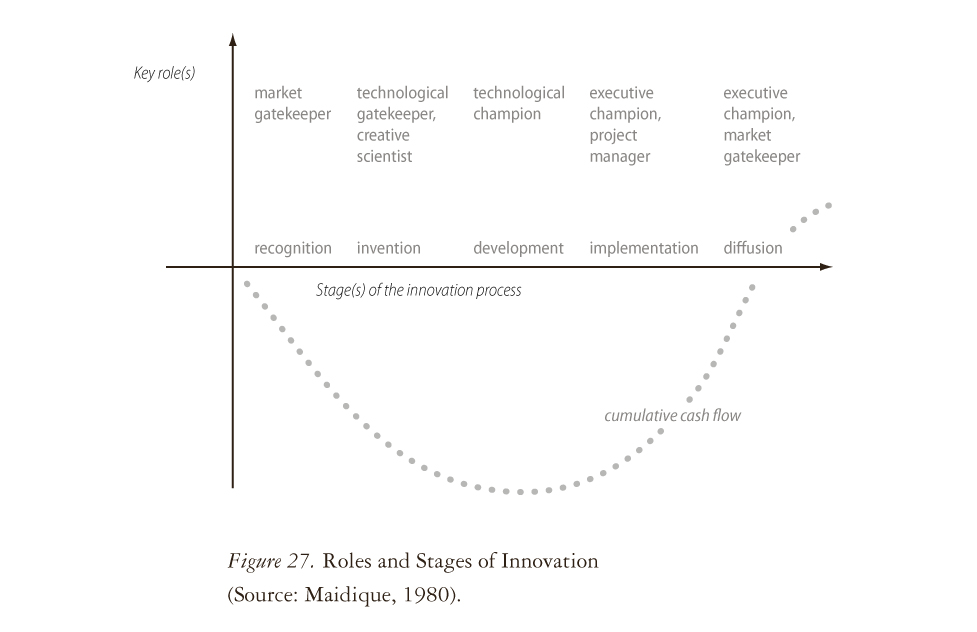
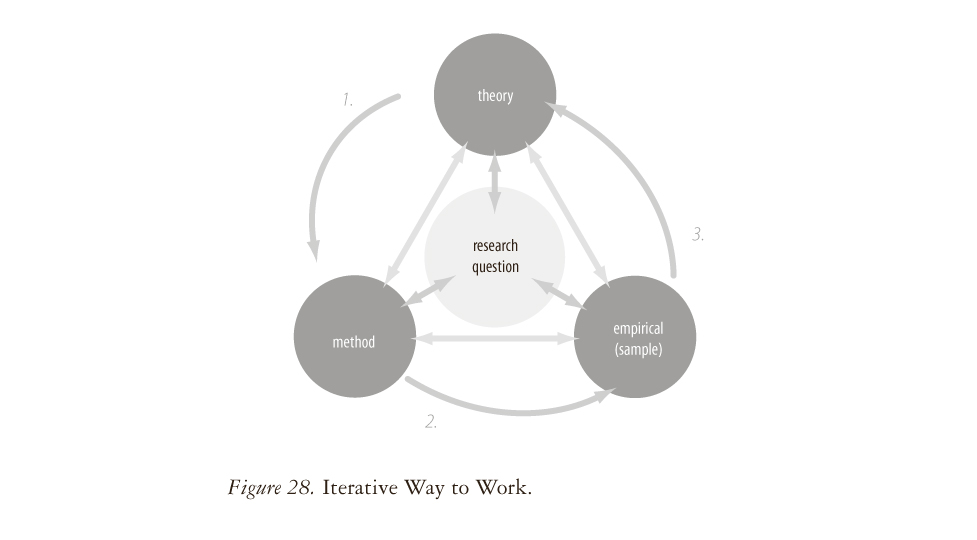
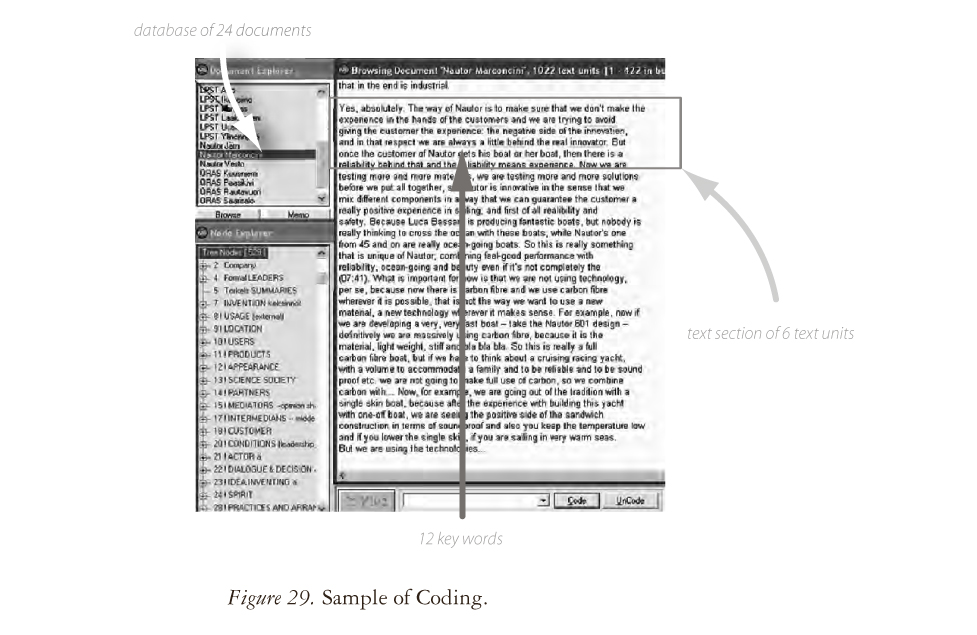
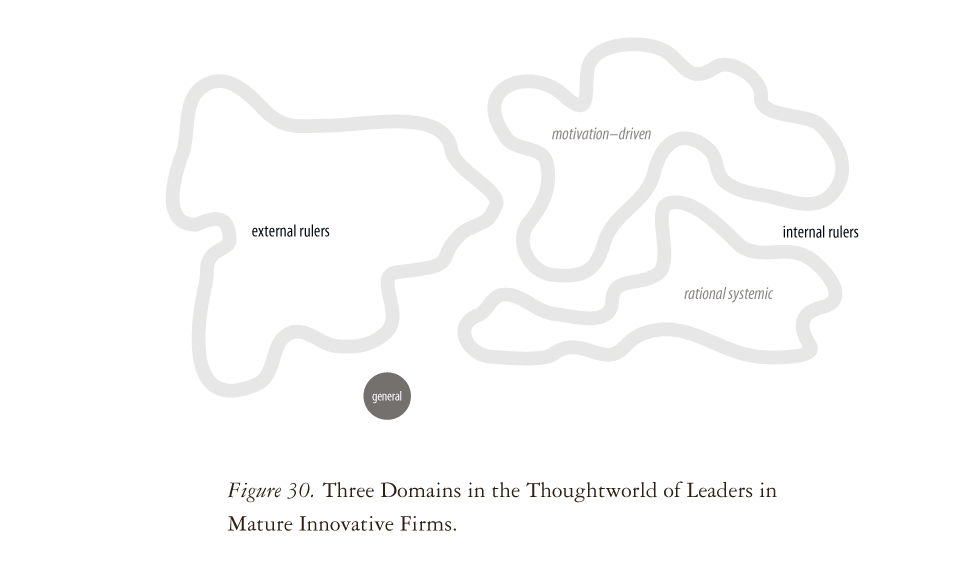
Figure 31. Landscape of Attention in the Thoughtworld of Leaders in Mature Innovative Firms, p. 135
Figure 32. Detailed Level Matrix of the Category Properties, p. 248
Figure 33. General Level Matrix of the Categories, p. 251
Figure 34. Illustration of Actor Network Theory, p. 254
Figure 35. Reassembling the Holistic Notion 'Innovation Leadership', p. 259
Figure 36. The Five Critical Areas of Attention in Leading Innovative Firms: An Illustration based on the Empirical Data, p. 261
Figure 37. Five Critical Elements Dependency Analysis Result, p. 289
Figure 38. Central Dependencies, p. 291
Figure 39. Peripheral Dependencies, p. 292
Figure 40. Loose Dependencies, p. 293
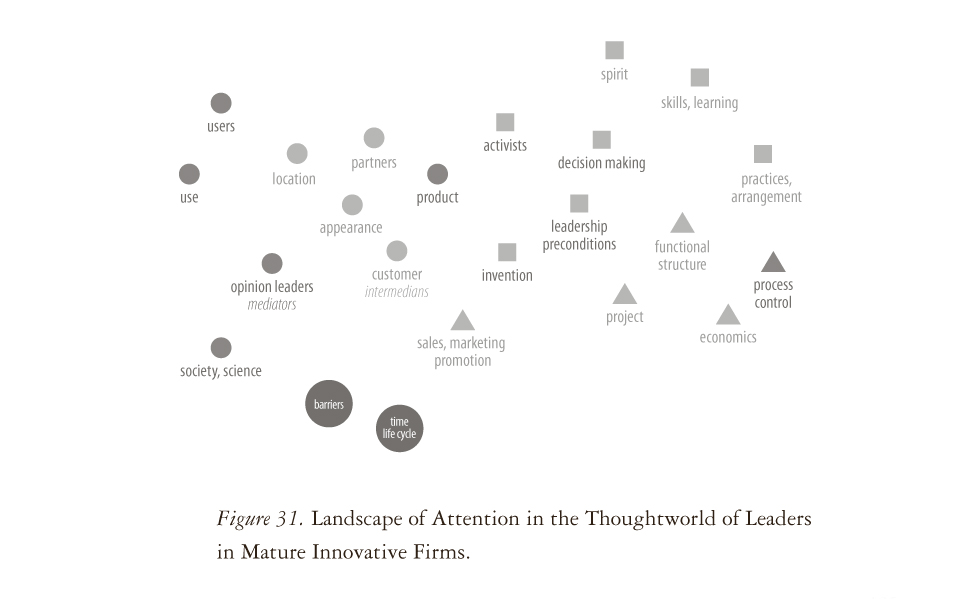
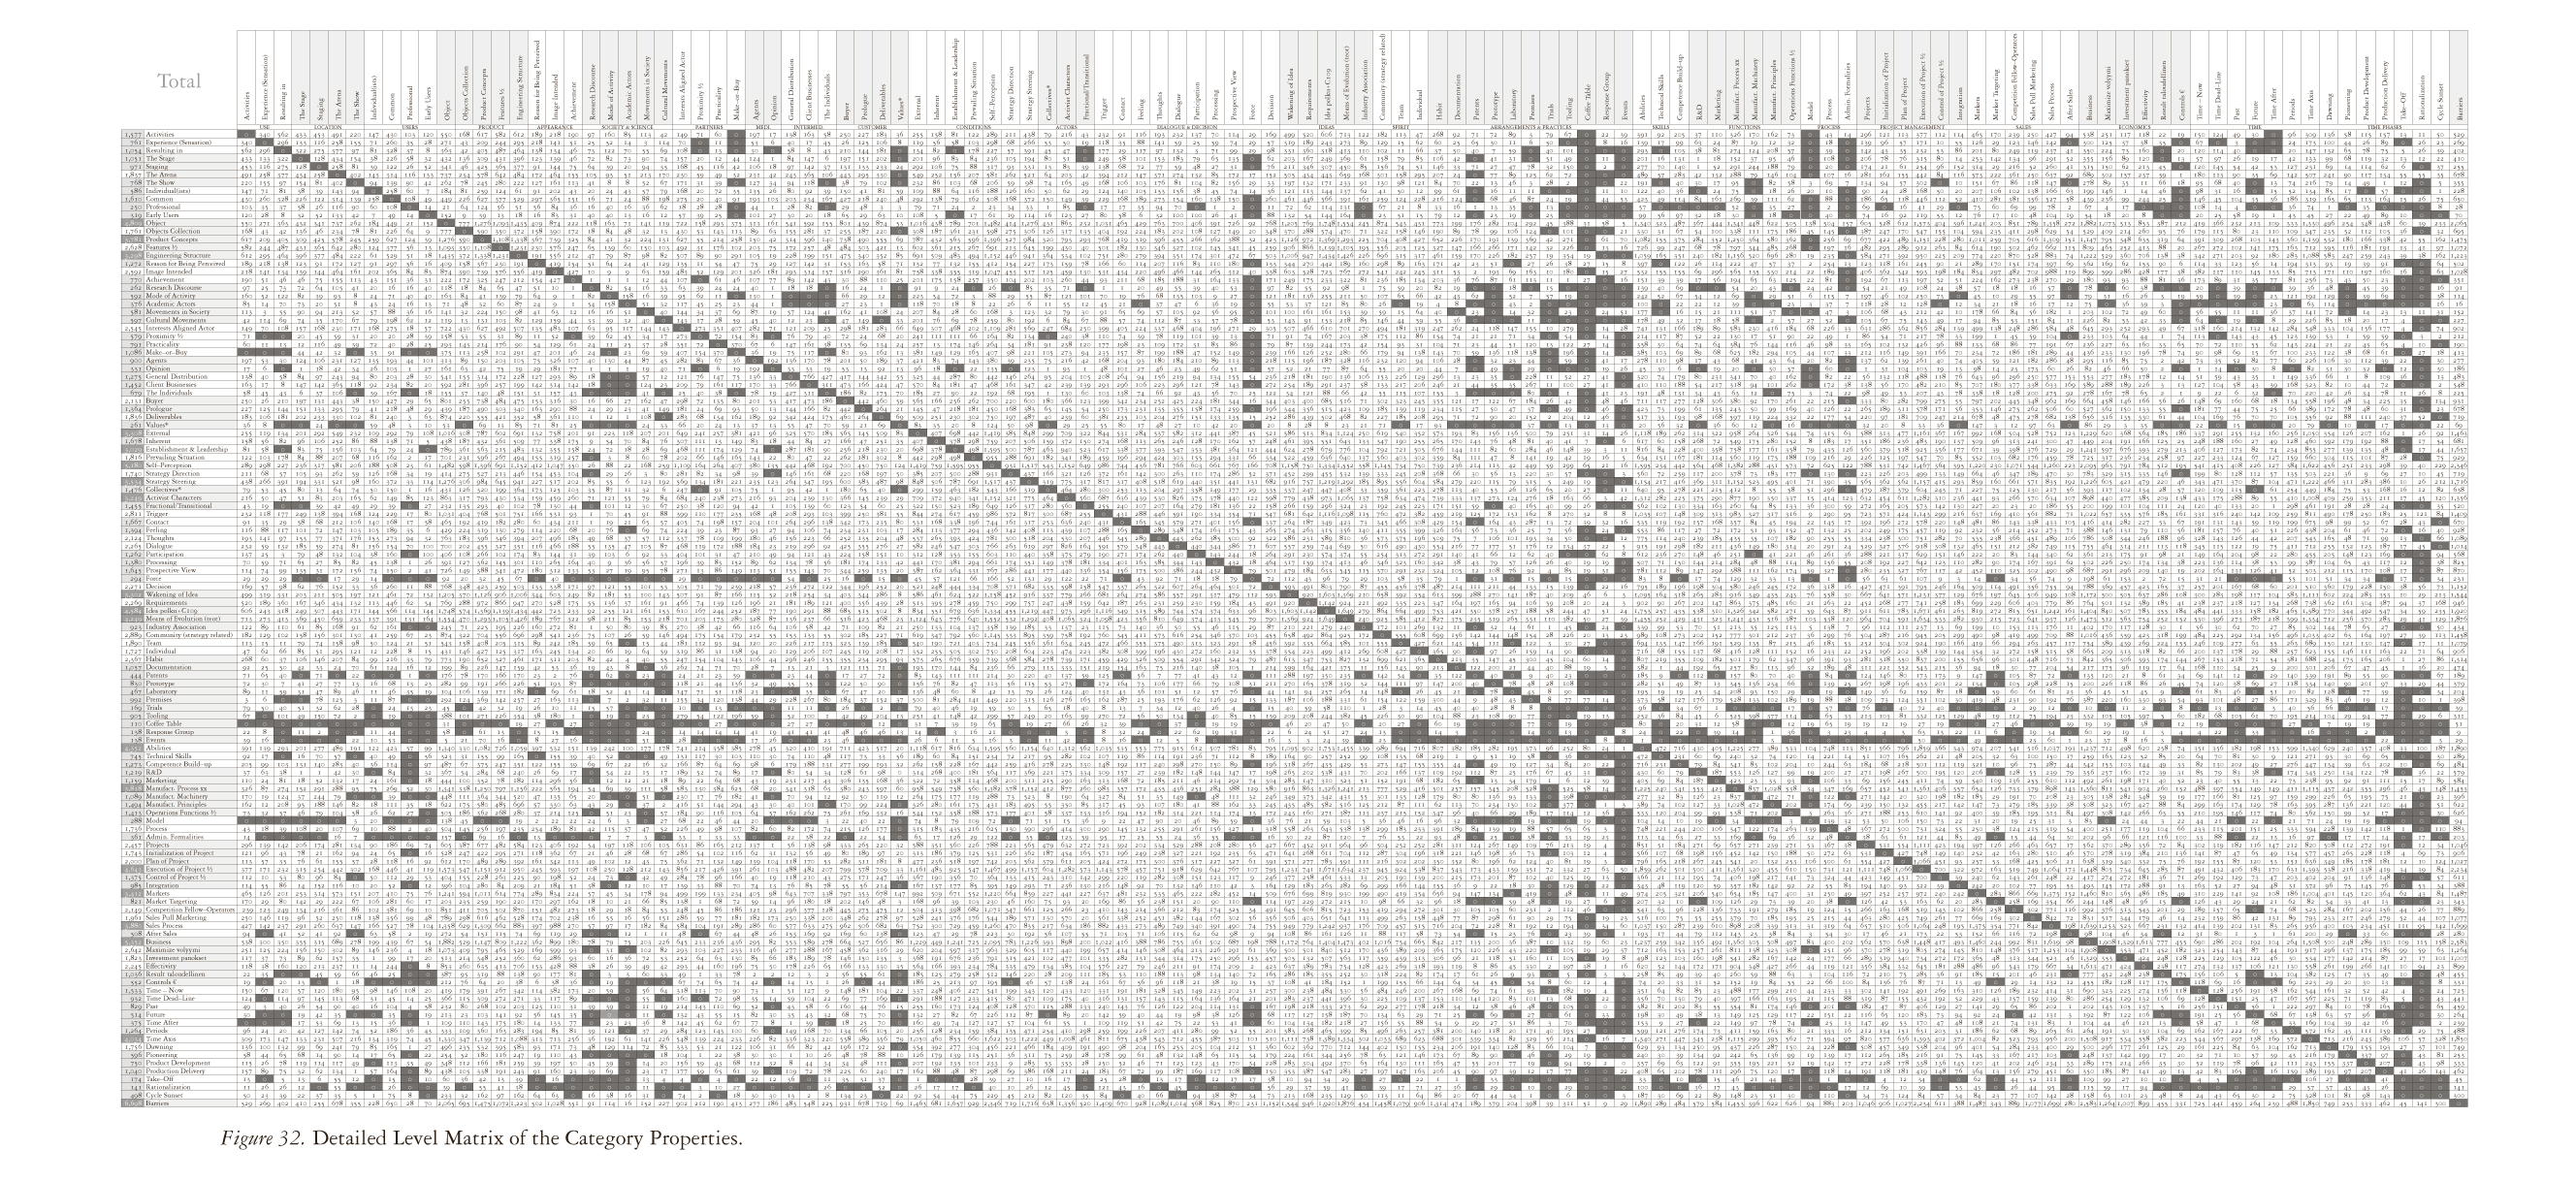
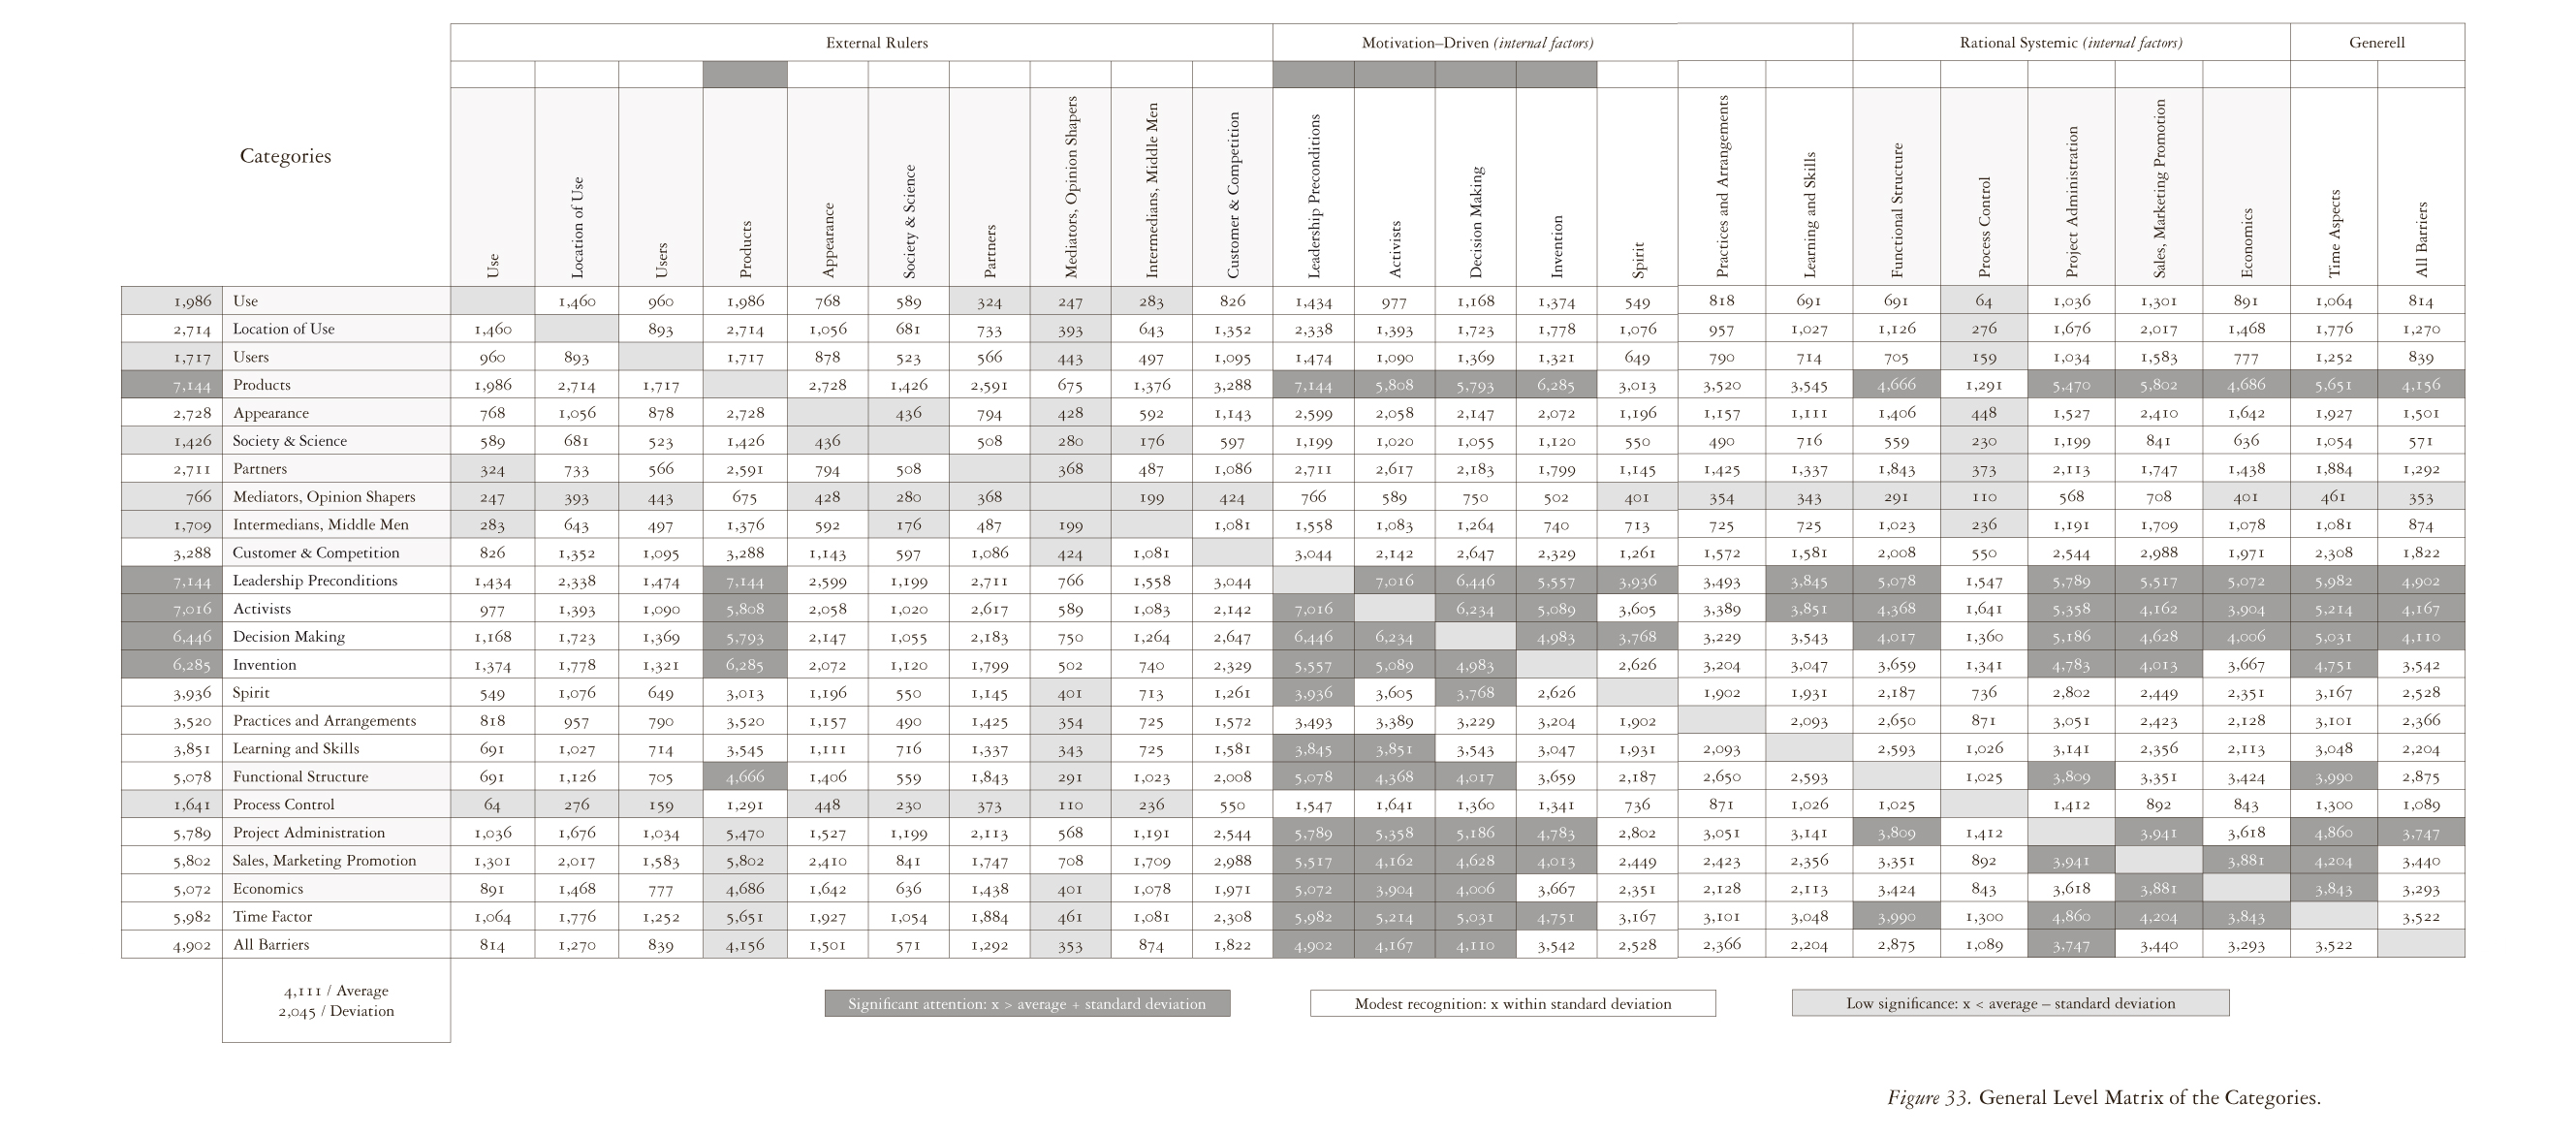
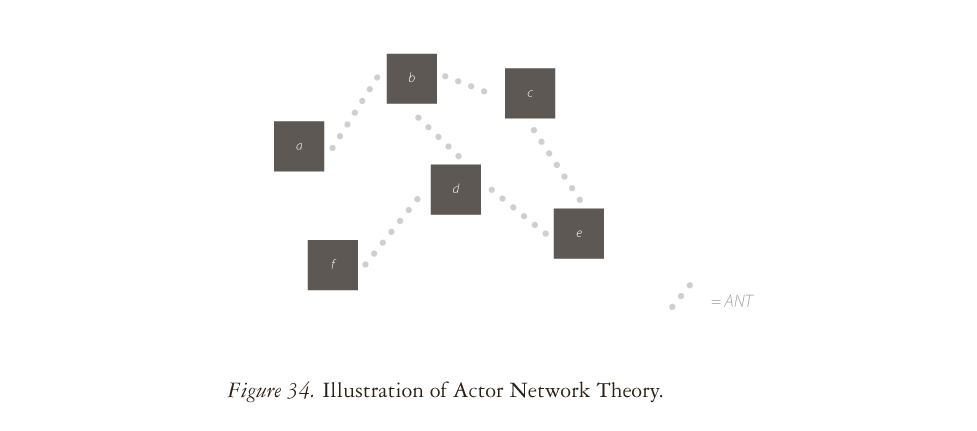
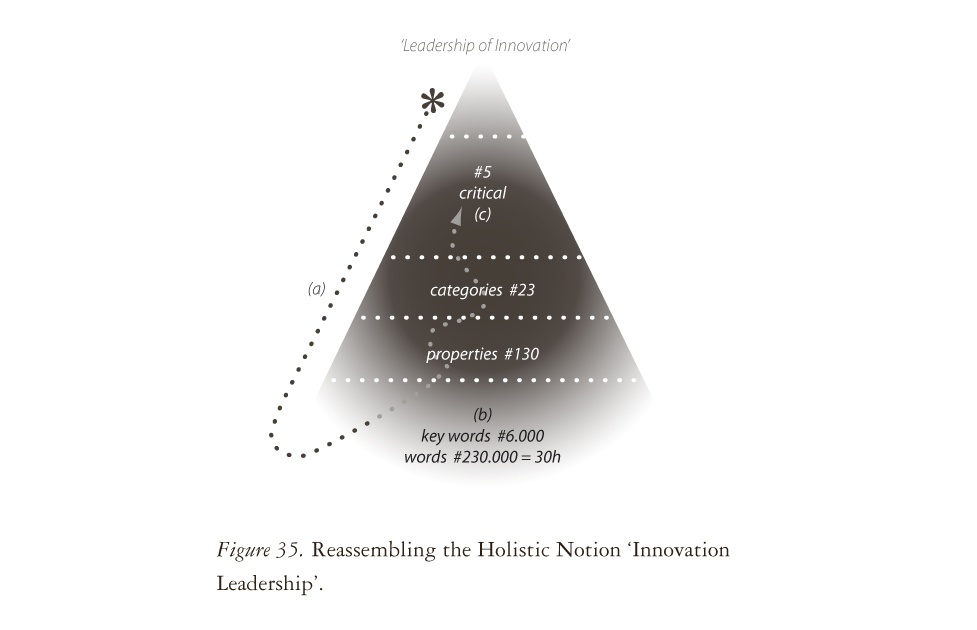

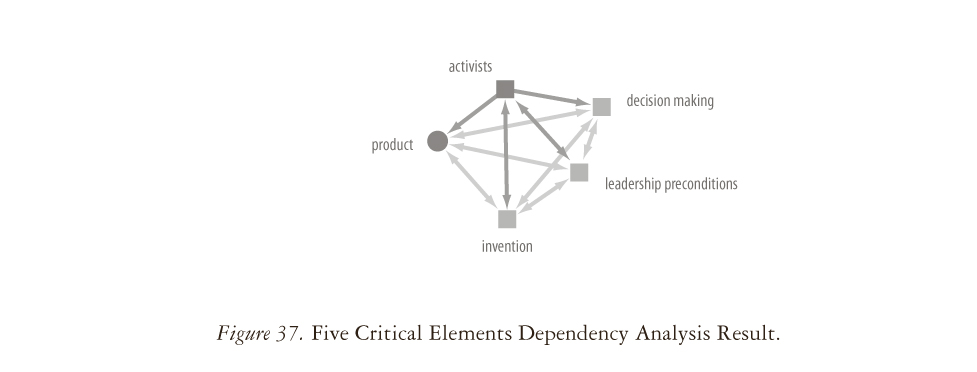
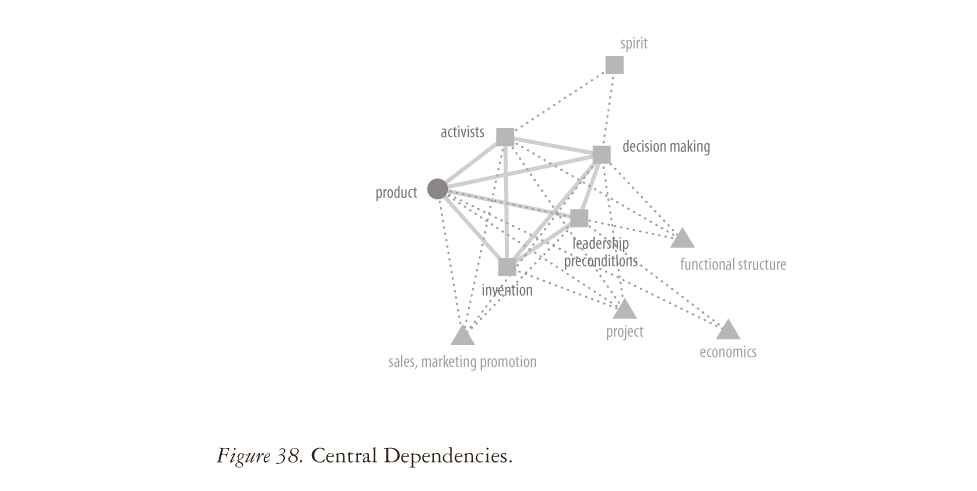
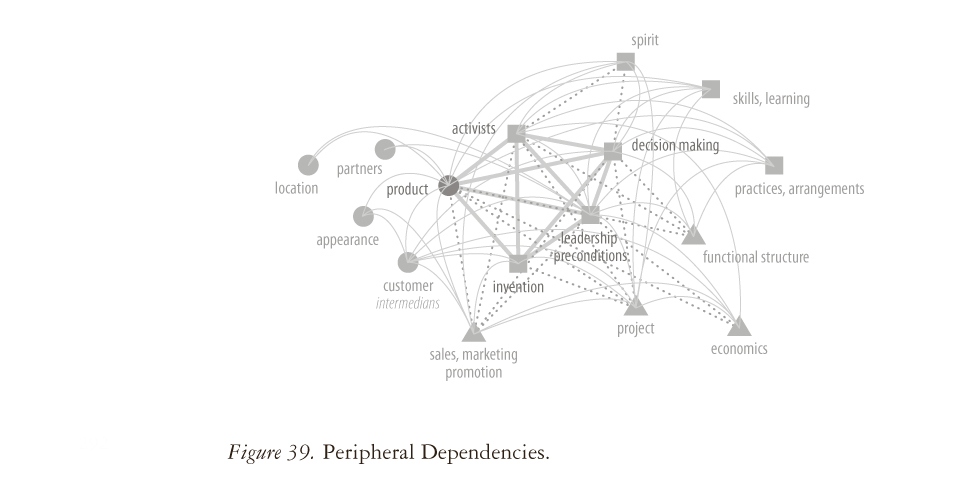
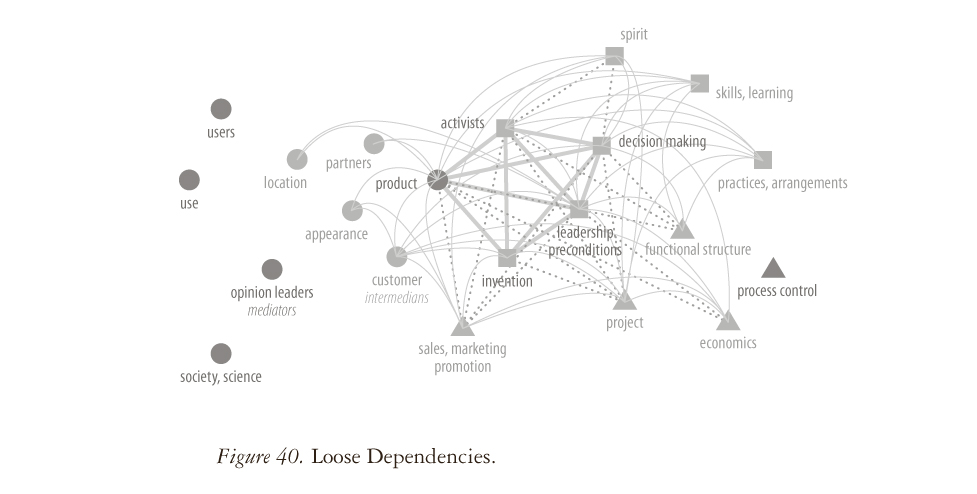
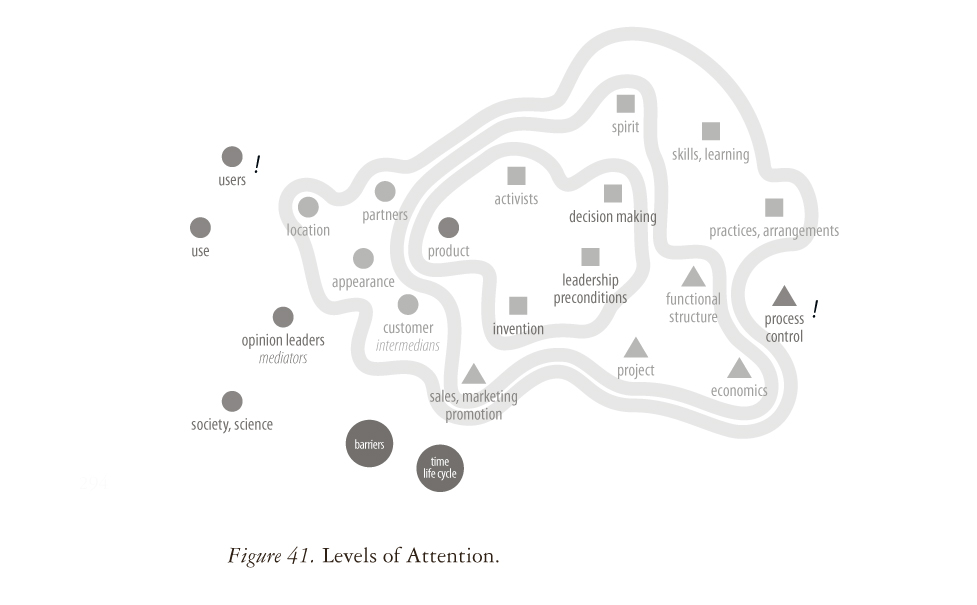
Figure 41. Levels of Attention, p. 294
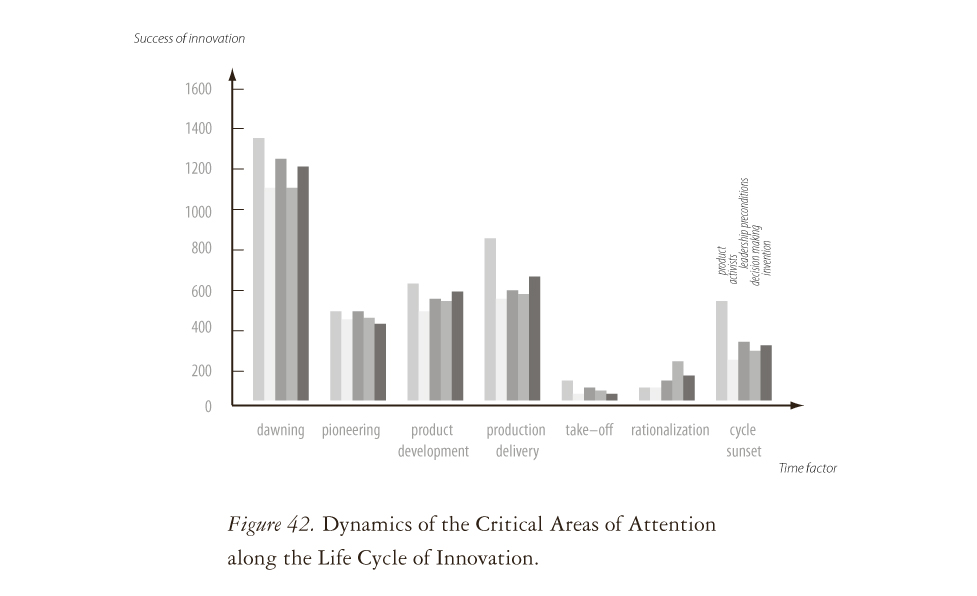
Figure 42. Dynamics of the Critical Areas of Attention along the Life Cycle of Innovation, p. 296
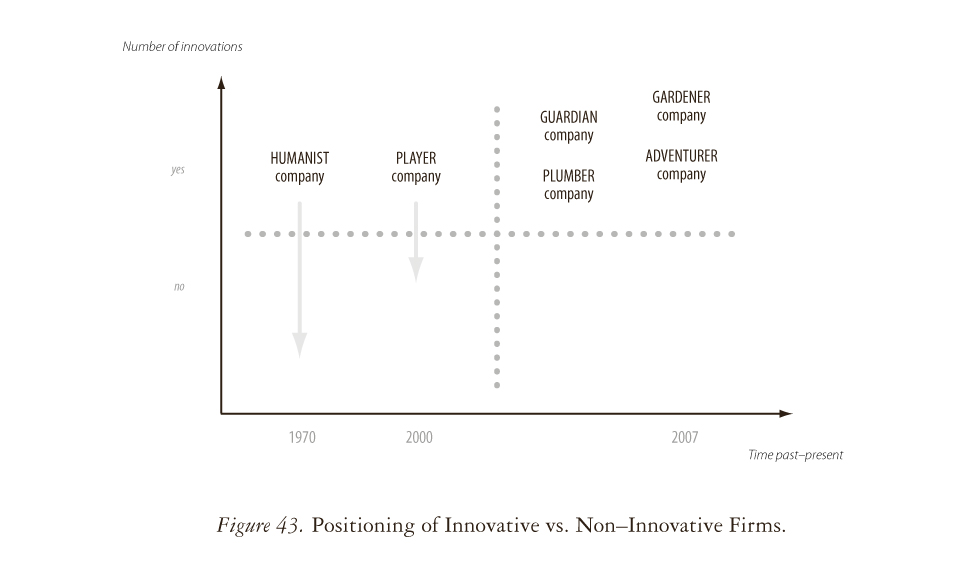
Figure 43. Positioning of Innovative vs. Non-Innovative Firms, p. 299